python庫skimage給灰度圖像染色的方法示例
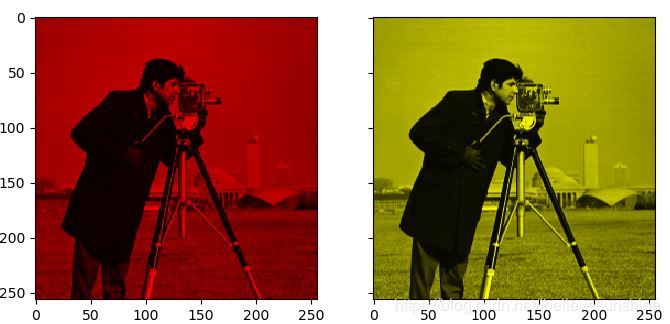
灰度圖像染成紅色和黃色
# 1.將灰度圖像轉(zhuǎn)換為RGB圖像image = color.gray2rgb(grayscale_image)# 2.保留紅色分量和黃色分量red_multiplier = [1, 0, 0]yellow_multiplier = [1, 1, 0]# 3.顯示圖像fig, (ax1, ax2) = plt.subplots(ncols=2, figsize=(8, 4),sharex=True, sharey=True)ax1.imshow(red_multiplier * image)ax2.imshow(yellow_multiplier * image)
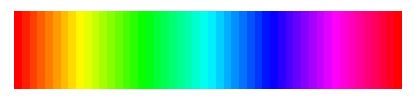
HSV圖像,H從0到1表示的顏色
hue_gradient = np.linspace(0, 1)# print(hue_gradient.shape) # output:(50,)hsv = np.ones(shape=(1, len(hue_gradient), 3), dtype=float)hsv[:, :, 0] = hue_gradientall_hues = color.hsv2rgb(hsv)fig, ax = plt.subplots(figsize=(5, 2))# Set image extent so hues go from 0 to 1 and the image is a nice aspect ratio.ax.imshow(all_hues, extent=(0, 1, 0, 0.2))ax.set_axis_off()
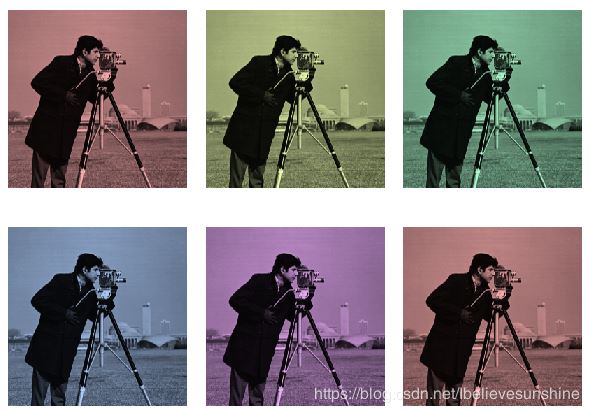
將灰度圖像染成不同的顏色
hue_rotations = np.linspace(0, 1, 6)fig, axes = plt.subplots(nrows=2, ncols=3, sharex=True, sharey=True)for ax, hue in zip(axes.flat, hue_rotations): # Turn down the saturation to give it that vintage look. tinted_image = colorize(image, hue, saturation=0.3) ax.imshow(tinted_image, vmin=0, vmax=1) ax.set_axis_off()fig.tight_layout()
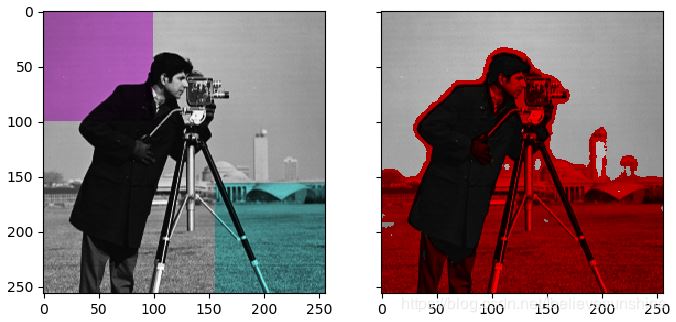
完整代碼
'''=========================Tinting gray-scale images=========================It can be useful to artificially tint an image with some color, either tohighlight particular regions of an image or maybe just to liven up a grayscaleimage. This example demonstrates image-tinting by scaling RGB values and byadjusting colors in the HSV color-space.In 2D, color images are often represented in RGB---3 layers of 2D arrays, wherethe 3 layers represent (R)ed, (G)reen and (B)lue channels of the image. Thesimplest way of getting a tinted image is to set each RGB channel to thegrayscale image scaled by a different multiplier for each channel. For example,multiplying the green and blue channels by 0 leaves only the red channel andproduces a bright red image. Similarly, zeroing-out the blue channel leavesonly the red and green channels, which combine to form yellow.'''import matplotlib.pyplot as pltfrom skimage import datafrom skimage import colorfrom skimage import img_as_floatgrayscale_image = img_as_float(data.camera()[::2, ::2])image = color.gray2rgb(grayscale_image)red_multiplier = [1, 0, 0]yellow_multiplier = [1, 1, 0]fig, (ax1, ax2) = plt.subplots(ncols=2, figsize=(8, 4),sharex=True, sharey=True)ax1.imshow(red_multiplier * image)ax2.imshow(yellow_multiplier * image)####################################################################### In many cases, dealing with RGB values may not be ideal. Because of that,# there are many other `color spaces`_ in which you can represent a color# image. One popular color space is called HSV, which represents hue (~the# color), saturation (~colorfulness), and value (~brightness). For example, a# color (hue) might be green, but its saturation is how intense that green is# ---where olive is on the low end and neon on the high end.## In some implementations, the hue in HSV goes from 0 to 360, since hues wrap# around in a circle. In scikit-image, however, hues are float values from 0# to 1, so that hue, saturation, and value all share the same scale.## .. _color spaces:# https://en.wikipedia.org/wiki/List_of_color_spaces_and_their_uses## Below, we plot a linear gradient in the hue, with the saturation and value# turned all the way up:import numpy as nphue_gradient = np.linspace(0, 1)# print(hue_gradient.shape) # output:(50,)hsv = np.ones(shape=(1, len(hue_gradient), 3), dtype=float)hsv[:, :, 0] = hue_gradientall_hues = color.hsv2rgb(hsv)fig, ax = plt.subplots(figsize=(5, 2))# Set image extent so hues go from 0 to 1 and the image is a nice aspect ratio.ax.imshow(all_hues, extent=(0, 1, 0, 0.2))ax.set_axis_off()####################################################################### Notice how the colors at the far left and far right are the same. That# reflects the fact that the hues wrap around like the color wheel (see HSV_# for more info).## .. _HSV: https://en.wikipedia.org/wiki/HSL_and_HSV## Now, let’s create a little utility function to take an RGB image and:## 1. Transform the RGB image to HSV 2. Set the hue and saturation 3.# Transform the HSV image back to RGBdef colorize(image, hue, saturation=1): ''' Add color of the given hue to an RGB image. By default, set the saturation to 1 so that the colors pop! ''' hsv = color.rgb2hsv(image) hsv[:, :, 1] = saturation hsv[:, :, 0] = hue return color.hsv2rgb(hsv)####################################################################### Notice that we need to bump up the saturation; images with zero saturation# are grayscale, so we need to a non-zero value to actually see the color# we’ve set.## Using the function above, we plot six images with a linear gradient in the# hue and a non-zero saturation:hue_rotations = np.linspace(0, 1, 6)fig, axes = plt.subplots(nrows=2, ncols=3, sharex=True, sharey=True)for ax, hue in zip(axes.flat, hue_rotations): # Turn down the saturation to give it that vintage look. tinted_image = colorize(image, hue, saturation=0.3) ax.imshow(tinted_image, vmin=0, vmax=1) ax.set_axis_off()fig.tight_layout()####################################################################### You can combine this tinting effect with numpy slicing and fancy-indexing# to selectively tint your images. In the example below, we set the hue of# some rectangles using slicing and scale the RGB values of some pixels found# by thresholding. In practice, you might want to define a region for tinting# based on segmentation results or blob detection methods.from skimage.filters import rank# Square regions defined as slices over the first two dimensions.top_left = (slice(100),) * 2bottom_right = (slice(-100, None),) * 2sliced_image = image.copy()sliced_image[top_left] = colorize(image[top_left], 0.82, saturation=0.5)sliced_image[bottom_right] = colorize(image[bottom_right], 0.5, saturation=0.5)# Create a mask selecting regions with interesting texture.noisy = rank.entropy(grayscale_image, np.ones((9, 9)))textured_regions = noisy > 4# Note that using `colorize` here is a bit more difficult, since `rgb2hsv`# expects an RGB image (height x width x channel), but fancy-indexing returns# a set of RGB pixels (# pixels x channel).masked_image = image.copy()masked_image[textured_regions, :] *= red_multiplierfig, (ax1, ax2) = plt.subplots(ncols=2, nrows=1, figsize=(8, 4),sharex=True, sharey=True)ax1.imshow(sliced_image)ax2.imshow(masked_image)plt.show()####################################################################### For coloring multiple regions, you may also be interested in# `skimage.color.label2rgb http://scikit-# image.org/docs/0.9.x/api/skimage.color.html#label2rgb`_.
到此這篇關(guān)于python庫skimage給灰度圖像染色的方法示例的文章就介紹到這了,更多相關(guān)python 灰度圖像染色內(nèi)容請搜索好吧啦網(wǎng)以前的文章或繼續(xù)瀏覽下面的相關(guān)文章希望大家以后多多支持好吧啦網(wǎng)!
相關(guān)文章:
1. python 寫一個(gè)文件分發(fā)小程序2. Python本地及虛擬解釋器配置過程解析3. Python importlib模塊重載使用方法詳解4. Vue3中使用this的詳細(xì)教程5. Python 利用flask搭建一個(gè)共享服務(wù)器的步驟6. Python中Anaconda3 安裝gdal庫的方法7. 用python對oracle進(jìn)行簡單性能測試8. Python自動(dòng)化之定位方法大殺器xpath9. Python類綁定方法及非綁定方法實(shí)例解析10. Python Selenium破解滑塊驗(yàn)證碼最新版(GEETEST95%以上通過率)

 網(wǎng)公網(wǎng)安備