用Python繪制漫步圖實(shí)例講解
我們首先來(lái)看下代碼:
import matplotlib.pyplot as pltfrom random import choiceclass RandomWalk(): def __init__(self,num_points=5000): self.num_points=num_points self.x_values=[0] self.y_values=[0] def fill_walk(self): while len(self.x_values)<self.num_points: x_direction=choice([1,-1]) x_distance=choice([0,1,2,3,4]) x_step=x_direction*x_distance y_direction=choice([1,-1]) y_distance=choice([0,1,2,3,4]) y_step=y_direction*y_distance if x_step==0 and y_step==0: continue next_x=self.x_values[-1]+x_step next_y=self.y_values[-1]+y_step self.x_values.append(next_x) self.y_values.append(next_y)rw=RandomWalk()rw.fill_walk()plt.scatter(rw.x_values,rw.y_values,s=1)plt.show()
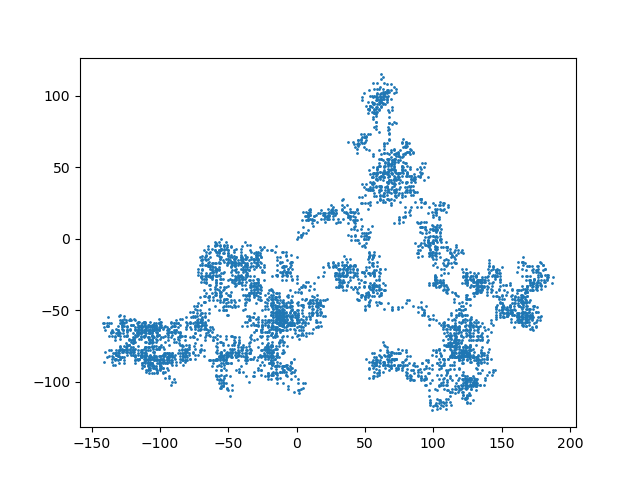
繪制出的圖如下所示:

這段代碼繪制了5000個(gè)數(shù)據(jù)點(diǎn),這些點(diǎn)的分布完全是隨機(jī)的。每次運(yùn)行代碼都會(huì)有不同的走向。
實(shí)例擴(kuò)展:
from random import choice class RandomWalk(): '''一個(gè)生成隨機(jī)漫步數(shù)據(jù)的類''' def __init__(self,num_points=5000): '''初始化隨機(jī)漫步的屬性''' self.num_points = num_points #所有隨機(jī)漫步都始于(0,0) self.x_values = [0] self.y_values = [0] def fill_walk(self): '''計(jì)算隨機(jī)漫步包含的所有點(diǎn)''' #不斷漫步,直到列表達(dá)到指定的長(zhǎng)度 while len(self.x_values) < self.num_points: # 決定前進(jìn)方向以及沿這個(gè)方向前進(jìn)的距離 x_direction = choice([1,-1]) x_distance = choice([0,1,2,3,4]) x_step = x_direction * x_distance y_direction = choice([1,-1]) y_distance = choice([0,1,2,3,4]) y_step = y_direction * x_distance # 拒絕原地踏步 if x_step == 0 and y_step == 0: continue #計(jì)算下一個(gè)點(diǎn)的x和y值 next_x = self.x_values[-1] + x_step next_y = self.y_values[-1] + y_step self.x_values.append(next_x) self.y_values.append(next_y)
import matplotlib.pyplot as plt from random_walk import RandomWalk # 創(chuàng)建一個(gè)RandomWalk實(shí)例,并將其包含的點(diǎn)都繪制出來(lái)rw = RandomWalk(50000)rw.fill_walk() # 設(shè)置繪圖窗口的尺寸plt.figure(dpi=80,figsize=(10,6)) # 設(shè)置點(diǎn)按先后順序增加顏色深度point_numbers = list(range(rw.num_points))plt.scatter(rw.x_values,rw.y_values,c=point_numbers,cmap=plt.cm.Blues, edgecolor=’none’,s=1) # 突出起點(diǎn)和終點(diǎn),起點(diǎn)設(shè)置為綠色,終點(diǎn)設(shè)置為紅色plt.scatter(0,0,c=’green’,edgecolor=’none’,s=100)plt.scatter(rw.x_values[-1],rw.y_values[-1],c=’red’,edgecolor=’none’,s=100) # 隱藏坐標(biāo)軸plt.axes().get_xaxis().set_visible(False)plt.axes().get_yaxis().set_visible(False) plt.show()
第二個(gè)實(shí)例內(nèi)容差不多,是用的PY3.5,大家可以本地測(cè)試下。
到此這篇關(guān)于用Python繪制漫步圖實(shí)例講解的文章就介紹到這了,更多相關(guān)使用Python繪制漫步圖內(nèi)容請(qǐng)搜索好吧啦網(wǎng)以前的文章或繼續(xù)瀏覽下面的相關(guān)文章希望大家以后多多支持好吧啦網(wǎng)!
相關(guān)文章:
1. IntelliJ IDEA設(shè)置默認(rèn)瀏覽器的方法2. IntelliJ IDEA設(shè)置背景圖片的方法步驟3. Spring security 自定義過(guò)濾器實(shí)現(xiàn)Json參數(shù)傳遞并兼容表單參數(shù)(實(shí)例代碼)4. docker /var/lib/docker/aufs/mnt 目錄清理方法5. JAMon(Java Application Monitor)備忘記6. Python TestSuite生成測(cè)試報(bào)告過(guò)程解析7. Python 的 __str__ 和 __repr__ 方法對(duì)比8. 學(xué)python最電腦配置有要求么9. Python Scrapy多頁(yè)數(shù)據(jù)爬取實(shí)現(xiàn)過(guò)程解析10. Python OpenCV去除字母后面的雜線操作

 網(wǎng)公網(wǎng)安備